April 2024
What is this page?
This page lists the scientific contributions of an author, who either does not have a ResearchGate profile, or has not yet added these contributions to their profile.
It was automatically created by ResearchGate to create a record of this author's body of work. We create such pages to advance our goal of creating and maintaining the most comprehensive scientific repository possible. In doing so, we process publicly available (personal) data relating to the author as a member of the scientific community.
If you're a ResearchGate member, you can follow this page to keep up with this author's work.
If you are this author, and you don't want us to display this page anymore, please let us know.
Publications (57)

November 2023
·
89 Reads
·
4 Citations
Nano Letters


July 2023
·
3 Reads
·
3 Citations
Journal of Micro/Nanopatterning Materials and Metrology
May 2023


April 2023
·
61 Reads
·
2 Citations


Metasurfaces are 2D planar lattices of nanoparticles that allow the manipulation of incident light properties. Because of that attribute, metasurfaces are promising candidates to replace bulky optical components. Traditionally, metasurfaces are made from a periodic arrangement of identical unit cells. However, more degrees of freedom are accessible if an increasing number of structured unit cells are combined. The present study explores a type of dielectric metasurface with complex supercells composed of Mie-resonant dielectric nanocylinders and nanoscale rings. We numerically and experimentally demonstrate the signature of an optical response that relies on the structures sustaining staggered optically induced magnetic dipole moments. The optical response is associated with an optical antiferromagnetism. The optical antiferromagnetism exploits the presence of pronounced coupling between dissimilar Mie-resonant dielectric nanoparticles. The coupling is manipulated by engineering the geometry and distance between the nanoparticles, which ultimately enhances their effective magnetic response. Our results suggest possible applications in resonant nanophotonics by broadening the modulation capabilities of metasurfaces.
March 2022
·
41 Reads


December 2021
·
330 Reads
·
14 Citations
Conventional optical diffusers, such as thick volume scatterers (Rayleigh scattering) or microstructured surface scatterers (geometric scattering), lack the potential for on-chip integration and are thus incompatible with next-generation photonic devices. Dielectric Huygens' metasurfaces, on the other hand, consist of two-dimensional arrangements of resonant dielectric nanoparticles and therefore constitute a promising material platform for ultra-thin and highly efficient photonic devices. When the nanoparticles are arranged in a random but statistically specific fashion, diffusers with exceptional properties are expected to come within reach. In this contribution, we explore how dielectric Huygens' metasurfaces can be used to implement wavelength-selective diffusers with negligible absorption losses and nearly-Lambertian scattering profiles that are largely independent of the angle and polarization of incident waves. We show that the combination of tailored positional disorder with a carefully-balanced electric and magnetic response of the nanoparticles is an integral requirement for the operation as a diffuser. We experimentally and numerically characterize the directional scattering performance of the proposed metasurfaces and highlight their usability in wavefront-shaping applications. Since our metasurfaces operate on the principles of Mie scattering and are embedded in a glassy environment, they may easily be incorporated in integrated photonic devices, fiber optics, or mechanically robust augmented reality displays. This article is protected by copyright. All rights reserved

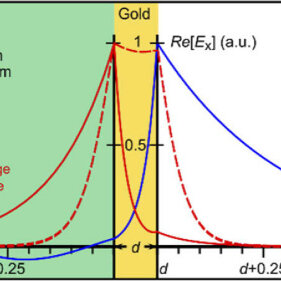


![SNOM measurement of the LR-SPP mode. (a-c) Topography, optical amplitude and phase images, respectively. The optical measurements correspond to the 3rd harmonic order of the pseudo-heterodyne SNOM. (d) Extracted SPP field real part $Re[E_{ext, SPP} ]$ R e [ E e x t , S P P ] . (e) Averaged field profile from (d) where the solid blue line is the theoretically calculated SPP field profile, and the dotted line is the experimentally measured field profile.](https://www.researchgate.net/publication/355053146/figure/fig5/AS:11431281243601523@1715718338101/SNOM-measurement-of-the-LR-SPP-mode-a-c-Topography-optical-amplitude-and-phase_Q320.jpg)
October 2021
·
39 Reads
·
1 Citation
In this study, we explore analytically and experimentally long- and short-range surface plasmon polariton (LR-SPP and SR-SPP, respectively) modes in gold wedges. Especially, we aim to observe the 2-dimensional confinement of the electromagnetic field in gold wedges as it could enhance the light-matter interaction by offering a local density of states which depends on the propagation constant, consequently on the wedge height. The LR-SPP mode can propagate over a long distance, but the real part of the propagation constant remains relatively insensitive to the decreasing wedge height. This mode also experiences cut-off at a wedge height of about 50 nm in our experimental condition. Meanwhile, the SR-SPP mode has a large propagation constant that increases further with decreasing wedge height. As a result, the effective wavelength of the mode shrinks confining the electromagnetic wave longitudinally along the propagation direction in addition to enhancing the transverse confinement of SR-SPP. In the experiment, we use gold wedges with different edge heights to excite each SPP mode individually and image the electromagnetic near field by using a pseudo-heterodyne scattering scanning near-field optical microscope. By imaging the LR-SPP mode field, we demonstrate that the theoretical and measured values of the effective wavelength agree quite well. By using short wedges, we measure the SR-SPP mode field and demonstrate that the effective wavelength decreases to 47% in about half a micrometer of propagation distance. This corresponds to a 3.5 times decrease of the vacuum wavelength or an effective index of 3.5. It is important to note that this value is, by no means, the limit of the electromagnetic field’s longitudinal confinement in a gold wedge. Rather, we were only able to measure the electromagnetic field up to this point due to our measurement limitations. The electromagnetic field will be propagating further, and the longitudinal confinement will increase as well. In conclusion, we measured the SR-SPP in a gold wedge and demonstrate the electromagnetic field confinement in the visible spectrum in gold wedges.


October 2021
·
179 Reads
·
4 Citations
A wide variety of near-field optical phenomena are described by the interaction of dipole radiation with a nanophotonic system. The electromagnetic field due to the dipole excitation is associated with the Green’s function. It is of great interest to investigate the dipole interaction with a photonic system and measure the near-field Green’s function and the quantities it describes, e.g., the local and cross density of optical states. However, measuring the near-field Green’s function requires a point-source excitation and simultaneous near-field detection below the diffraction limit. Conventional single-tip near-field optical microscope (SNOM) provides either a point source excitation or amplitude and phase detection with subwavelength spatial resolution. The automated dual-tip SNOM, composed of two tips, has overcome the experimental challenges for simultaneous near-field excitation and detection. Here, we investigate the dipole emission in the near-field of a dielectric metasurface using the automated dual-tip SNOM. We have analyzed the near-field pattern and directional mode propagation depending on the position of the dipole emission relative to the metasurface. This study is one further step toward measuring the dyadic Green’s function and related quantities such as cross density of optical states in complex nanophotonic systems for both visible and near-infrared spectra.


September 2021
·
62 Reads
·
1 Citation

We experimentally realize a series of incommensurable metasurface stacks that transition from near-field coupling to a far-field regime. Based on a comparison between a semi-analytic model and measurements, we, furthermore, present an experimental study on the validity of the fundamental mode approximation (FMA). As the FMA is a condition for the homogeneity of a metasurface, its validity allows for strong simplification in the design of stacked metasurfaces. Based on this, we demonstrate a method for the semi-analytic design of stacked periodic metasurfaces with arbitrary period ratios. In particular, incommensurable ratios require computational domains of impractically large sizes and are usually very challenging to fabricate. This results in a noticeable gap in parameter space when optimizing metasurface stacks for specific optical features. Here, we aim to close that gap by utilizing the principles of the FMA, allowing for additional parameter combinations in metasurface design.
Citations (27)
... The coupling between plasmonic nanocavities and TMD-based materials has been demonstrated as an effective means to enhance the emission properties of TMDs [10][11][12][13]. This enhancement can be analyzed in two ways. ...
- Citing Article
November 2023
Nano Letters
... In this model, it is supposed that the energy of a system of such particles depends on the orientation of different magnetic dipole moments relative to each other as well as to an externally applied magnetic field [14]. Recently, it has been proposed to study different magnetic orders with metasurfaces [15][16][17][18][19][20][21][22][23]. They are arrays of artificially structured subwavelength resonant particles that facilitate reaching the desirable electromagnetic functionality. ...
- Citing Article
- Publisher preview available
April 2023
... The Purcell factor accounts for the enhancement of spontaneous emission of an emitter due to the optical states compared to a homogeneous background [57][58][59][60][61]. The near-field intensity distribution in the surroundings of the nanoparticles determines the LDOS [62,63]. Specifically, strong electromagnetic energy concentrations in small volumes lead to high Purcell factors [64,65]. ...
- Citing Article
- Full-text available
October 2021
... [37,38] Other variants regard membranes with an array of dielectric nanocylinders made, for example, from amorphous silicon and embedded in amorphous silicon oxide. [32,[39][40][41][42][43][44][45][46][47] Although the precision and accuracy of especially lithographic manufacturing processes have steadily increased with the stage of their development, [32,42,43] fabrication errors and disorder remain still decisive issues. The extent to which perturbations of morphological order affect photonic systems depends on the type of disorder and their relation to various geometrical and material quantities. ...
- Citing Article
- Full-text available
December 2021
... In particular, as the metasurfaces are conceptually handled as homogeneous layers, SASA enables us to layer metasurfaces of inconsummerable periods without the need to define huge unit cells. An in depth discussion and experimental validation of SASA is published in Ref. [32]. ...
- Citing Article
- Full-text available
September 2021
... Because the optical response of metasurface usually relies on the dimensions and dielectric properties, substantial efforts have explored the tuning mechanisms of integrating active materials into nanostructures. By leveraging external stimuli such as mechanical actuation [47][48][49] , chemical reactions 50 , optical 51,52 , electrical 53-58 and thermal [59][60][61][62] schemes, light field distributions of these active metasurfaces exhibit dynamically control-lable functionalities, offering a programmable flexibility in information processing and storage. In particular, chalcogenide phase-change materials (PCMs) are uniquely poised for the photonic modulation and resonance tuning of active metasurfaces, owing to their striking portfolio of properties [63][64][65][66][67][68][69] . ...
- Citing Article
- Full-text available
June 2021
ACS Photonics
... This has already led to profound findings such as light localization in lattice structures written in photorefractive materials [5], the ability to engineer the plasmon dispersion relation in evanescently coupled metasurfaces [2] and the discovery of exotic optical states exhibiting characteristics of both moiré flat bands and (quasi-)bound states in the continuum [6]. However, a deeper understanding of moiré effects from first principles and their impact on photonic band structures remains a prime challenge for current research in nano-optics [1,7,8] and numerical and computational methods that can explore such systems are investigated more recently [9][10][11][12][13][14]. Moiré flat bands have also been explored in graphene nanoribbons [15], electric circuits with extremely high degrees of freedom [16] and 1D electronic geometries [17]. ...
- Citing Article
December 2020
... CD spectroscopy has found widespread applications in various scientific disciplines including chemistry [2,3], biochemistry [4,5], and material science [6][7][8]. Recently, chiral optical metasurfaces have emerged as a promising platform to enhance CD spectroscopy in compact integrated photonic setups, based on their capabilities to manipulate circularly polarized light at the nanoscale and control the light polarization state efficiently [9][10][11][12]. Chiral metasurfaces consisting of subwavelength nanostructures with symmetry breaking patterns enable the precise chiroptical control of the amplitude, phase, and polarization of the incident light, which have been widely used in many fields such as chiral imaging [13,14], optical encryption [15,16], and optical communication [17]. ...
- Citing Article
November 2020
ACS Nano
... It is known that light waves carry energy and linear and angular momenta [1]. For the nanoparticles (NPs) placed in the path of light propagation, the linear momenta will lead to optical gradient forces, while the angular momenta creates an optical torque, which causes the particle to rotate [2]. ...
- Citing Article
April 2020
ACS Nano


... The inclusion of high-index nanopillar arrays adds a phase shift to the cavity and leads to a subsequent shift in the resonant peak [19,39]. Then, by adding anisotropy to the nanostructures, the FP cavity becomes sensitive to polarization [40]. However, reconstruction via the use of algorithms must be applied to recover the polarization spectrum, causing low detection speed and insufficient measurement accuracy. ...
- Citing Article
- Full-text available
June 2020
