Raquel Marco-Ferreres's research while affiliated with European Molecular Biology Laboratory and other places

What is this page?


This page lists the scientific contributions of an author, who either does not have a ResearchGate profile, or has not yet added these contributions to their profile.

It was automatically created by ResearchGate to create a record of this author's body of work. We create such pages to advance our goal of creating and maintaining the most comprehensive scientific repository possible. In doing so, we process publicly available (personal) data relating to the author as a member of the scientific community.

If you're a ResearchGate member, you can follow this page to keep up with this author's work.

If you are this author, and you don't want us to display this page anymore, please let us know.

Publications (32)


Properties of high-confidence E/P interactions
(a) Clustering of interaction frequencies at all high-confidence E/P interactions only called in one condition (colored bars in Fig. 1d), showing increase (orange) or decrease (gray) relative to the sample average. The majority of unique interactions have the highest interaction frequency in the condition (tissue/time point) where they were called significant (Fig. 1d) compared to all others. (b,c) Violin plots/boxplots of the number of high-confidence interactions (CHiCAGO score ≥5 and DHS overlap) per bait at the indicated developmental time/tissue for E/P baits active (b) or inactive (c) in the indicated condition. Number of interactions for active (b) or inactive (c) baits, as well as the total number of high-confidence interactions for all baits indicated above. Number of baits active (b) or inactive (c) is indicated below the plot. (d) Violin plots/boxplots displaying the distribution of genomic distances between the bait and ‘other end’ for all high-confidence interactions (CHiCAGO score ≥5, DHS overlap) identified in the 5 conditions. (e) P(s) plot displaying the probability of observing interactions at a given distance/separation between the bait and ‘other end’. Over developmental time there are fewer proximal interactions (<10 kb) and more distal interactions (>10 kb). In the identification of differential interactions (DESeq2 analysis; Methods), a normalization process was applied to account for these differences in the P(s) curves. (f) Bar chart depicting the fraction of high-confidence interactions per bait (y-axis) crossing TAD boundaries (x-axis, up to ≥10 boundaries) based on boundary annotation from whole embryos from ref. ³⁶. (g) Violin plots/boxplots displaying the fraction of intra-TAD high-confidence interactions per baits in the 5 conditions. TAD annotation was based on ref. ³⁶. For boxplots in b, c, d, g: center = median, upper and lower bounds = interquartile range, whiskers = minimum and maximum).
Differential E/P interactions are highly correlated with differential DHS, but not vice versa
(a) 2D density plot displaying DNase-seq (DHS) signal at the ‘other end’ with respect to interaction frequency at differential E/P interactions (left panel, DHS to interaction) or changes in interaction frequency with respect to changes in DNase-seq signal at differential DHS (right panel, Interaction to DHS). Increase or decrease of interaction frequency at differential E/P interactions is generally correlated with a concordant change in DHS (left panel). Changes in DHS signal (at differential DHS regions) are less correlated with changes in interaction frequencies (right panel). (b) Example locus showing coordinated and non-coordinated changes: normalized Capture-C counts at the zfh1 promoter bait (highlighted in light pink) have a high-confidence interaction (leftmost rectangle) in both muscle and neurons at 10-12 h. Below, DNase-seq and H3K27ac ChIP–seq signal in matched conditions. The differential stage-specific E/P interaction overlaps a stage-specific DHS (left rectangle (black dashed outline)) in both conditions—and is an example of concordant changes in differential DHS and chromatin interactions. Other highly tissue-specific DHS or H3K27ac peaks (middle, blue dashed rectangle), which are in-between the bait (red bar) and the 10-12 h differential interaction, do not show a comparable increase in interaction frequency. Although these regions (middle blue dashed rectangle) are part of the zfh1 regulatory landscape, the increase in, for example, DHS signal between Myo 6-8 h and Neuro 6-8 h is not mirrored by a concordant increase in interaction frequency. Other highly tissue- and/or stage-specific DHS and H3K27ac peaks to the right of the zfh1 bait (right, green dashed rectangle) show very low interaction frequency and are not part of the zfh1 regulatory landscape, again demonstrating that high DHS signal in the same tissue/time point is not necessarily linked to high E/P interaction frequency. (c) Similar to (a) for H3K27ac ChIP–seq signal, showing a general correlation between changes of interaction frequency and the underlying H3K27ac signal, while the reverse (changes in H3K27ac compared to interaction frequency) is less correlated.
Motif enrichment at E/P loops—instructive tissue-specific loops are enriched in motifs for tissue-specific transcription factors
(a) Identification of potential factors involved in the formation of E/P loops. Tissue- and stage-matched DHS (from ref. ³²) were divided into two groups, a test set in proximity (<500 bp) to all significant interactions and a control set (composed of a non-overlapping DHS set that is in proximity (<500 bp) to non-significant interactions). Enrichment of Drosophila melanogaster transcription factor motifs (from CIS-BP) in the test DHS relative to control DHS (Methods). Plot shows motifs enriched in the indicated sample using an adjusted p-value cutoff of 1 × 10⁻⁴. (b) Motif enrichment comparing constant interactions to differential interactions (using DHS underlying differential interactions as the background set for enrichment calculation). Plots show motifs enriched in the indicated sample using an adjusted p-value cutoff of 1 × 10⁻⁴. All four factors have multiple PWMs, which are variants on TAATTA sequence, suggesting that this enrichment likely comes from the same factor. (c) Motif enrichment at differential interactions. DHS were divided into three groups based on their proximity (<500 bp) to increased, decreased or “other” (non-increased and non-decreased) E/P interacting regions characterized in the same tissue/time condition. Enrichment of Drosophila transcription factor motifs (from CIS-BP) in either the increased or decreased DHS, relative to other DHS in the same condition, was carried out using the AME tool (doi: 10.1186/1471-2105-11-165). In (a), (b) and (c) for the background, only DHS >10 kb and <250 kb from the bait were considered, and enrichments for all, promoter proximal and promoter distal DHS (≥500 bp) are shown separately. p-values in (a), (b) and (c) were calculated using a one-sided Fisher exact test.
Differential Capture-C interactions at the Toll-7 locus represent functional enhancer elements
(a) Upper: normalized Capture-C signal at the Toll-7 locus in 4 conditions. Vertical light pink bar = bait (Toll-7 promoter), gray bars (zoom-in) = position of interacting regions tested for enhancer activity. Genomic location of BAC probes used for DNA FISH (blue, magenta rectangles) and genomic regions tested in transgenic enhancer assays (labeled 1-4) are shown below. Lower: zoom-in showing DNase-seq (DHS), H3K27ac and insulator ChIP signal in the 4 tested elements Toll-7 1-4 and Toll-7 gene. Differential interaction between Toll-7 promoter and CR44506 at 10-12 h in neurons is accompanied by differential CTCF binding in neurons at 10-12 h (black arrowhead). Muscle-specific Toll-7 promoter and Toll-74 coincide with adjacent muscle-specific CTCF binding (red arrow). Perhaps differential insulator binding plays a role in differential E/P interactions at this locus. (b) Double fluorescence in situ hybridization of transgenic embryos testing Toll-7 1-4 for enhancer activity. Yellow = reporter (lacZ), magenta = Toll-7 RNA. Toll-7 2-4 have sporadic enhancer activity in a small subset of cells (scale bars = 50 µm). (c) Immunofluorescence (IF)-DNA FISH: above, IF signal of Elav expression in the ventral nerve cord (false-colored in cyan, DAPI in gray) of stage 16 embryo (lateral view, single optical section, scale bar = 50 µm). Below, DNA FISH (yellow = Toll-7, magenta = CR44506, BAC probes position indicated in (a). Zoom-in of Elav+ (lower left) or Elav− (lower right) region (maximum projection from deconvolved image stacks, scale bars = 2 µm). 3D distance between Toll-7-CR44506 was measured in neuronal (Elav+) and adjacent non-neuronal (Elav−) tissue within the same embryos. (d) Violin plot/boxplot of DNA FISH distance between Toll-7 and CR44506 in neuronal (blue = Elav+) and non-neuronal (gray = Elav−) tissue. Dashed line = 250 nm. Percentage with distances <250 nm, number (n) of nuclei measured indicated underneath. The two loci are significantly closer in neuronal compared to non-neuronal cells at 10-12 h and 16-18 h. P-values from Kolmogorov-Smirnov test (two-sided). Boxplot: center = median, upper/lower bounds = first/third quartiles, whiskers = lowest/highest at min/max 1.5 interquartile range, dots = outliers plotted individually.
Tissue-specific promoter interacting regions are often enhancers active in that tissue
(a) Upper: normalized Capture-C, DNase-seq and H3K27ac ChIP–seq signal at the lame duck (lmd) locus in 4 different conditions. Vertical red bar = lmd promoter (bait), gray bars = tested interacting region (lmd 1) in transgenic embryos. Lower: RNA in situ hybridization in transgenic embryos for the reporter gene (yellow, lacZ) and the lmd gene (magenta) at the indicated stages, for lmd 1. (b–e) As in (a) for Delta (Dl) interacting regions (b), roundabout 3 (robo3) region (c), huckebein (hkb) region (d) and vesicular acetylcholine transporter (VAChT) region (e) (scale bars = 50 µm). Five of the tested regions (5/19) either had enhancer activity that did not match the interacting gene’s expression (VAChT (e), Oli 4 (Fig. 5)), or did not match the tissue-specific interactions (Dl 2, (b)), or had no enhancer activity (Dop1R1, Toll-7 1 (Extended Data Fig. 4b)) (Supplementary Table 1). For example, the interacting region with the VAChT promoter (e) had enhancer activity in the central nervous system, but curiously only in cells adjacent to the gene’s expression. The Dl 2 interacting region (b) has activity overlapping the Dl gene’s expression in the endoderm and visceral muscle, but this does not match the predominantly neuronal-specific interaction between the Dl 2 enhancer and the Dl promoter at 10-12 h (b). Some interacting elements might be bystander interactions in a gene dense and/or very compact locus (that is, cases where the enhancer’s activity does not match the interacting gene’s expression) or might serve a different regulatory function (that is, cases where the element does not function as an enhancer at all for example Toll-7 1).

+5

Enhancer–promoter interactions become more instructive in the transition from cell-fate specification to tissue differentiation
  • Article
  • Full-text available

March 2024

·

111 Reads

·

2 Citations

Nature Genetics

·

Adam Rabinowitz

·

Maria Cristina Gambetta

·

[...]

·

To regulate expression, enhancers must come in proximity to their target gene. However, the relationship between the timing of enhancer–promoter (E–P) proximity and activity remains unclear, with examples of uncoupled, anticorrelated and correlated interactions. To assess this, we selected 600 characterized enhancers or promoters with tissue-specific activity in Drosophila embryos and performed Capture-C in FACS-purified myogenic or neurogenic cells during specification and tissue differentiation. This enabled direct comparison between E–P proximity and activity transitioning from OFF-to-ON and ON-to-OFF states across developmental conditions. This showed remarkably similar E–P topologies between specified muscle and neuronal cells, which are uncoupled from activity. During tissue differentiation, many new distal interactions emerge where changes in E–P proximity reflect changes in activity. The mode of E–P regulation therefore appears to change as embryogenesis proceeds, from largely permissive topologies during cell-fate specification to more instructive regulation during terminal tissue differentiation, when E–P proximity is coupled to activation.

Download
Share


Chromatin gene-gene loops support the cross-regulation of genes with related function

December 2023

·

36 Reads

·

1 Citation

Molecular Cell

Chromatin loops between gene pairs have been observed in diverse contexts in both flies and vertebrates. Combining high-resolution Capture-C, DNA fluorescence in situ hybridization, and genetic perturbations, we dissect the functional role of three loops between genes with related function during Drosophila embryogenesis. By mutating the loop anchor (but not the gene) or the gene (but not loop anchor), we disentangle loop formation and gene expression and show that the 3D proximity of paralogous gene loci supports their co-regulation. Breaking the loop leads to either an attenuation or enhancement of expression and perturbs their relative levels of expression and cross-regulation. Although many loops appear constitutive across embryogenesis, their function can change in different developmental contexts. Taken together, our results indicate that chromatin gene-gene loops act as architectural scaffolds that can be used in different ways in different contexts to fine-tune the coordinated expression of genes with related functions and sustain their cross-regulation.


New enhancer-promoter interactions are gained during tissue differentiation and reflect changes in E/P activity

December 2022

·

47 Reads

·

2 Citations

To regulate gene expression, enhancers must come into proximity with their target gene. At some loci the timing of enhancer-promoter proximity is uncoupled from gene activation, while at others it is tightly linked. Here, we assessed this more globally for 600 characterized enhancers or promoters (E/P) with tissue-specific activity in Drosophila embryos, by performing Capture-C and insulator ChIP in FACS-purified myogenic or neurogenic cells at different stages of embryogenesis. This high-resolution view enabled direct comparison between E/P interactions and activity across 5 developmental conditions. This revealed largely invariant E/P contacts between the blastoderm and cell fate specification stages, despite changes in activity. However, E/P interactions diverge during terminal tissue differentiation when many tissue-specific interactions are gained on top of a pre-existing topology. Changes in E/P proximity reflect changes in enhancer activity and gene activation, and are generally not accompanied by changes in insulator binding. Using transgenes and deletions, we show that many tissue-specific interactions represent functional E-P pairs. Our results reveal a shift in E-P landscapes as embryogenesis proceeds, from largely pre-formed topologies at early stages to more distal tissue-specific loops during differentiation, when E/P proximity appears coupled to activation.


Figure 2. iLEXY enables rapid efficient nuclear protein export with tunable recovery times in embryos (A-F) Blue-light-induced changes in Twist-mCherry-LEXY (A and D), Twist-mCherry-iLEXYi (B and E), and Twist-mCherry-iLEXYs (C and F) localization observed by live confocal imaging of mCherry in stage 9-10 embryos. mCherry-expressing cells were imaged over a time course of blue light induction (blue rectangle, A-C) and subsequent recovery in the dark. (A-C) Mean (line) ± SD (shading) of the nuclear/cytoplasmic mCherry fluorescence ratio relative to the first time point. Note, for Twist-mCherry-iLEXYs (C) induction and recovery were recorded separately. See also Videos S1 and S2 and Figure S2. (D-F) Examples of the mCherry signal before (left panel) and during (right panel) blue light induction from time courses shown earlier. Dashed lines indicate the position of nuclei. Scale bars, 5 mm. (G-I) LED-based induction of iLEXY. (G) Inside the LED blue light box. The transparent sample stage is approximately equidistant from the LEDs at the top and bottom. (H) Subcellular localization of Twist-mCherry-iLEXYs visualized by a-Twist staining with DAPI in homozygous embryos incubated in the dark or 60 min under blue light in the LED box. Blue light induction (bottom) leads to nuclear Twist depletion and gastrulation defects. Dorsal up, anterior left; scale bars 50 mm. Insets show individual cells from the same embryos at high magnification. Nuclei are outlined by dashed lines. Scale bars, 5 mm. (I) Twist localization quantified as nuclear/cytoplasmic fluorescence ratios of a-Twist signal from cells of wild-type (WT) embryos (white boxplot) or of twist-LEXY, twist-mCherry-iLEXYi, and twi-mCherry-iLEXYs embryos incubated in the dark (gray) or LED blue light (blue boxplots) averaged across stages 6, 8, and 10. Figure S2F shows ratios for each embryonic stage separately. Examples of corresponding stains are shown in Figures 2H and S2E.
Figure 3. iLEXY-mediated nuclear Twist depletion phenocopies twist loss-of-function mutant (A) Blue-light-dependent viability of wild-type (WT) and homozygous embryos with twist tagged to different LEXY variants. Hatching assays of embryos to first instar wandering larvae were performed under increasing blue light LED intensities. Data points represent mean ± SD of at least two independent experiments and 50 embryos per experiment. (B) Gastrulation of ventral furrow (vf) cells and germ layer separation in homozygous twist-mCherry-iLEXYs embryos incubated continuously in the dark or blue light. Immunostaining with a-Twist antibody is shown as single plane ventral views of external and internal cells (stage 7 embryos) and as maximum intensity projections of lateral views (stage 8 embryos). Positions of the ectodermal (ec) and mesodermal (ms) layer are indicated by arrows. The presence of the posterior transverse furrow (ptf) was used to identify stage 7 embryos. Anterior left, dorsal up in bottom panel; scale bars, 50 mm. (C) Formation of mesoderm-derived muscles in nuclear Twist-depleted embryos. Z-projections show stage 16 embryos of the indicated genotypes incubated in the dark or blue light throughout embryogenesis. Wild-type (WT) and twist loss-of-function mutant embryos (twist 1 /twist 1 ) are shown for comparison. a-tropomyosin and a-Elav immunostainings visualize muscles and nervous system, respectively. Dorsal up, anterior left; scale bars, 50 mm. The number of embryos with the presented phenotype is indicated (top right) in (B) and (C). See also Figure S4.
Extremely rapid and reversible optogenetic perturbation of nuclear proteins in living embryos

August 2021

·

259 Reads

·

21 Citations

Developmental Cell

Many developmental regulators have complex and context-specific roles in different tissues and stages, making the dissection of their function extremely challenging. As regulatory processes often occur within minutes, perturbation methods that match these dynamics are needed. Here, we present the improved light-inducible nuclear export system (iLEXY), an optogenetic loss-of-function approach that triggers translocation of proteins from the nucleus to the cytoplasm. By introducing a series of mutations, we substantially increased LEXY’s efficiency and generated variants with different recovery times. iLEXY enables rapid (t1/2 < 30 s), efficient, and reversible nuclear protein depletion in embryos, and is generalizable to proteins of diverse sizes and functions. Applying iLEXY to the Drosophila master regulator Twist, we phenocopy loss-of-function mutants, precisely map the Twist-sensitive embryonic stages, and investigate the effects of timed Twist depletions. Our results demonstrate the power of iLEXY to dissect the function of pleiotropic factors during embryogenesis with unprecedented temporal precision.


Lineage-Resolved Enhancer and Promoter Usage during a Time Course of Embryogenesis

December 2020

·

48 Reads

·

41 Citations

Developmental Cell

Enhancers are essential drivers of cell states, yet the relationship between accessibility, regulatory activity, and in vivo lineage commitment during embryogenesis remains poorly understood. Here, we measure chromatin accessibility in isolated neural and mesodermal lineages across a time course of Drosophila embryogenesis. Promoters, including tissue-specific genes, are often constitutively open, even in contexts where the gene is not expressed. In contrast, the majority of distal elements have dynamic, tissue-specific accessibility. Enhancer priming appears rarely within a lineage, perhaps reflecting the speed of Drosophila embryogenesis. However, many tissue-specific enhancers are accessible in other lineages early on and become progressively closed as embryogenesis proceeds. We demonstrate the usefulness of this tissue- and time-resolved resource to definitively identify single-cell clusters, to uncover predictive motifs, and to identify many regulators of tissue development. For one such predicted neural regulator, l(3)neo38, we generate a loss-of-function mutant and uncover an essential role for neuromuscular junction and brain development.


Fig 3. Experimental assessment of new expression pattern predictions. a. Two examples of genes tested by FISH in stage 12 embryos, showing expression in brain and ventral nerve cord (vnc). b. Two examples of genes tested by FISH showing expression in different muscle types. Embryos are stage 14 (left) and stage 13 (right). sm: somatic muscle, vm: visceral muscle. c. Accurate predictions of Ppn complex expression patterns in late embryo. Top. Predictions of Ppn gene expression for all stage 13-16 tissue-stage terms. Scores are indicated either as fold enrichment above random expectation. Terms with high fold enrichments are outlined and colored according to the tissue type. Bottom. FISH for Ppn on embryos of different stages. The first two images correspond to the same embryo, where different focal planes have been selected to show expression on the dorsal vessel and visceral muscle. d. Accurate prediction of frequent muscle and midgut co-expression. Top. Table showing values for expression predictions in muscle and midgut at late embryos in the 8 genes we performed in situs for muscle expression validation. We bold the scores of genes with more than 10-fold enrichment in either tissue. Bottom. FISH images for the indicated genes in stage 13-14 embryos, with focal plane including both somatic muscle and gut. DAPI staining is included (blue signal) to show the shape of the embryo. Scale bar corresponds to 20μm in all images shown.
Fig 4. FISH validation of FIND temporal dynamics predictions. a. Expression prediction for TpnC47D up-regulation in muscle. Top. fold enrichment values of the TpnC47D gene for all BDGP terms including either "muscle" or "mesoderm", ordered from earliest to latest. The terms "Stage 11-12 muscle system primordium" and "Stage 13-16 embryonic larval muscle system", which represent the same group of structures in different stages, have been colored in red. Bottom. FISH images of the TpnC47D gene expression in stage 12 and stage 13 embryos. b. Prediction of relative changes in expression between muscle and gut for the bsf gene. Top. Same as in a, but also including gut-related terms. Midgut terms for Stage 11-12 and Stage 13-16 BDGP intervals have been colored in blue. Bottom. FISH images of the bsf gene expression in stage 12 and stage 13 embryos. https://doi.org/10.1371/journal.pgen.1008382.g004
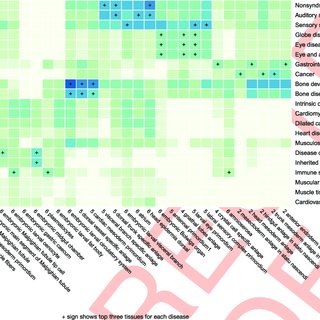
Fig 5. Prioritization of fly developmental tissues and stages for modeling human disease. Heatmap showing false discovery rate for enrichment of human OMIM disease gene functional orthologs in each tissue-stage combination, based on FIND predictions (p-value is computed based on PAGE). The number before tissue names indicate stages (1: stage 1-3, 2: stage 4-5, 3: stage 6-8, 4: stage 9-10, 5: stage 11-12, 6: stage 13-16). https://doi.org/10.1371/journal.pgen.1008382.g005
Identification of relevant tissues from whole-embryo differential expression datasets.
Accurate genome-wide predictions of spatio-temporal gene expression during embryonic development

September 2019

·

89 Reads

·

7 Citations

PLOS Genetics

PLOS Genetics

Comprehensive information on the timing and location of gene expression is fundamental to our understanding of embryonic development and tissue formation. While high-throughput in situ hybridization projects provide invaluable information about developmental gene expression patterns for model organisms like Drosophila, the output of these experiments is primarily qualitative, and a high proportion of protein coding genes and most non-coding genes lack any annotation. Accurate data-centric predictions of spatio-temporal gene expression will therefore complement current in situ hybridization efforts. Here, we applied a machine learning approach by training models on all public gene expression and chromatin data, even from whole-organism experiments, to provide genome-wide, quantitative spatio-temporal predictions for all genes. We developed structured in silico nano-dissection, a computational approach that predicts gene expression in >200 tissue-developmental stages. The algorithm integrates expression signals from a compendium of 6,378 genome-wide expression and chromatin profiling experiments in a cell lineage-aware fashion. We systematically evaluated our performance via cross-validation and experimentally confirmed 22 new predictions for four different embryonic tissues. The model also predicts complex, multi-tissue expression and developmental regulation with high accuracy. We further show the potential of applying these genome-wide predictions to extract tissue specificity signals from non-tissue-dissected experiments, and to prioritize tissues and stages for disease modeling. This resource, together with the exploratory tools are freely available at our webserver http://find.princeton.edu, which provides a valuable tool for a range of applications, from predicting spatio-temporal expression patterns to recognizing tissue signatures from differential gene expression profiles.


Citations (15)


... Furthermore, evolutionarily younger genes are associated with cell type-specific functions suggesting their potential role in tissue-specific programs. Interestingly, previous studies have shown that many loops involving enhancers and promoters may be tissue-specific during differentiation, and therefore related to cell type-specific gene regulation (118,119). Hence, the relationships of these recent era genes with 3D genomic features may be implicated in evolution of tissue-specific genome activity. Moreover, modifications to the dynamic 3D regulatory landscape may even shape species-specific programs (120)(121)(122)(123)(124)(125). ...

Reference:

Functional associations of evolutionarily recent human genes exhibit sensitivity to the 3D genome landscape and disease
Enhancer–promoter interactions become more instructive in the transition from cell-fate specification to tissue differentiation

Nature Genetics

... In these specialized systems, preformed E-P topologies might ensure robust and rapid gene activation 12,19 . Interestingly, the emergence of new E-P loops correlates with enhancer activation in differentiated Drosophila embryonic tissues, suggesting that E-P proximity could be an evolutionary conserved property of mid-late animal embryogenesis 55 . ...

New enhancer-promoter interactions are gained during tissue differentiation and reflect changes in E/P activity

... For this purpose, LEXY (Niopek et al. 2016;Kögler et al. 2021;Singh et al. 2022;Zhao et al. 2023), which allows for the reversible depletion of nuclear protein through blue-light inducible nuclear export was added to DL. To test the effects of depleting DL on target gene expression, nascent transcription was imaged live using the MS2/MCP system (H. ...

Extremely rapid and reversible optogenetic perturbation of nuclear proteins in living embryos

Developmental Cell

... Supporting this, reporter gene activities driven by fragments overlapping E1 and E2 have distinct spatial and temporal patterns that recapitulate the early and later embryonic expression patterns of shn, respectively (Additional file 1: Fig. S3g) [34]. These results are consistent with previous findings [37], and with the enhancer rather than promoter chromatin state driving tissue-specific DV transcription. ...

Lineage-Resolved Enhancer and Promoter Usage during a Time Course of Embryogenesis
  • Citing Article
  • December 2020

Developmental Cell

... ChIP-seq has been used extensively across a broad spectrum of species, tissues, and cell types to interrogate the locations of TFs occupying specific sites in chromatin or mapping the profile of histone modifications in chromatin (Wold and Myers 2008, Rivera and Ren 2013). This powerful technique has moved studies of gene regulation to a global (genome-wide) scale, and the data produced by this method form the foundation for many efforts to develop coherent, integrated models for gene regulation (Ching et al. 2018;Zhou et al. 2019;Xiang et al. 2020). However, the technique is not uniformly successful for all samples, and even when apparently successful, the resulting ChIPseq datasets vary widely in quality (Marinov et al. 2014;Devailly et al. 2015). ...

Accurate genome-wide predictions of spatio-temporal gene expression during embryonic development
PLOS Genetics

PLOS Genetics

... One important implication of our findings includes the possibility to link developmental enhancers/DARs/ DhMRs to their target DEGs. Linking enhancers to their target promoters remains a challenging problem [79][80][81][82]. To the best of our knowledge, the most successful approach so far was to link promoters to enhancers based on 100 K distance proximity of chromatin-accessible regions [83][84][85][86][87], without considering possible interference of neighbouring expressed genes. ...

The cis-regulatory dynamics of embryonic development at single-cell resolution

Nature

... Functional transitions between enhancers and silencers across biological contexts are pivotal in the precise and expeditious regulation of developmental processes (Erceg et al. 2017;Huang and Ovcharenko 2022). A substantial portion of candidate silencers and enhancers reported here have dual functions. ...

Dual functionality of cis-regulatory elements as developmental enhancers and Polycomb response elements

Genes & Development

... Based on power calculations (data not shown), our sample size of 354 inbred strain strains is well-above the statistical requirement to perform QTL studies. In comparison, the early development of eQTL was also performed in cross-bred strains (e.g., genome-wide eQTL of ∼ 100 strains of the Hybrid Mouse Diversity Panel (Bennett et al., 2010) and 205 inbred lines of Drosophila (Cannavò et al., 2017;W. Huang et al., 2014)). ...

Genetic variants regulating expression levels and isoform diversity during embryogenesis
  • Citing Article
  • December 2016

Nature

... The Cab strain of wild-type and Rho-TK:GFP transgenic medaka (Oryzias latipes) lines was maintained following standard conditions (i.e., 12 h/12 h dark/light conditions at 27°C). Embryos were staged according to Beccari et al (2015). All studies on fish were conducted in strict accordance with the Institutional Guidelines for animal research. ...

A trans-Regulatory Code for the Forebrain Expression of Six3.2 in the Medaka Fish

Journal of Biological Chemistry

... Patients with Parkinson's miR-204/211. miR-204/211 is widely expressed in neuronal tissues, including the cerebral cortex, hippocampus, eye, and choroid plexus [35,[42][43][44][45][46][47]. ...

The combination of transcriptomics and informatics identifies pathways targeted by miR-204 during neurogenesis and axon guidance

Nucleic Acids Research