Aaron Avery's scientific contributions

What is this page?


This page lists the scientific contributions of an author, who either does not have a ResearchGate profile, or has not yet added these contributions to their profile.

It was automatically created by ResearchGate to create a record of this author's body of work. We create such pages to advance our goal of creating and maintaining the most comprehensive scientific repository possible. In doing so, we process publicly available (personal) data relating to the author as a member of the scientific community.

If you're a ResearchGate member, you can follow this page to keep up with this author's work.

If you are this author, and you don't want us to display this page anymore, please let us know.

Publications (1)


Fig. 3. GoM Paleocene-Eocene supersequence framework addressed in this study modified from Galloway et al. (2009) using the time scale of Ogg et al. (2008). Abbreviations for the stratigraphic units referenced in this paper are the lower Wilcox (LW), middle Wilcox (MW), and upper Wilcox (UW) subgroups, and the Queen City (QC) and Sparta (SP) Formations. Hyperthermals are Paleocene-Eocene Thermal Maximum (PETM), Early Eocene Thermal Maximum 2 (ETM2), Early Eocene Climatic Optimum (EECO), and Middle Eocene Climatic Optimum (MECO) (Zachos et al., 2001, 2008; Sluijs et al., 2008a, 2008b). Deepwater grain volume history is from Galloway et al. (2009). Global sea level curves are based on backstripping by Miller et al. (2005) and Kominz et al. (2008).
Fig. 5. Biostratigraphic and organic geochemical records through the Paleocene-Eocene in (a) Big Horn (#27) and (b) Fredericksburg (#30) in Biofacies Region 2. Schematic lithological units in the Big Horn well include interbedded marls, shales, and siltstones through the Paleocene LW and MW to lower Eocene UW, and Claiborne and Jackson Gps. GR, SON and RES logs from Big Horn are used to calculate the TOC profile calibrated with sample-based measurements (TOCm; red circles). Percentages (over the total nannofossil population) of the oligotrophic nannofossil assemblage increase at the PETM with a decrease in the eutrophic nannofossil assemblage post-PETM, especially from the top of the UW through the Eocene. Planktonic foraminifers dominate the foraminifera assemblage except during a burst in radiolarian abundance following the PETM in the lower Eocene UW in Fredericksburg. (For interpretation of the references to color in this figure legend, the reader is referred to the Web version of this article.)
Fig. 7. Biostratigraphic, organic geochemical, and carbon isotopic records through the Paleocene-Eocene in the Chicxulub impact crater IODP Expedition364 Site M0077 borehole (#36) in Biofacies Region 3. Schematic lithological units range from the pre-K-Pg polymict breccia through the mixed limestones, marls, and shales of the Paleocene LW and MW into Eocene UW and Claiborne Gp. GR, SON and RES logs are used to calculate the TOC profile calibrated with sample-based measurements (TOCm) from this study (yellow diamonds) and previous work (red circles; Gulick et al., 2017). Organic carbon isotopes show a negative excursion over the PETM (gray bar) based on measurements from this study (blue squares) and those of Smith et al. (2020; black curve in blowup). Percentages (over the total nannofossil population) of the oligotrophic nannofossil assemblage spike during the PETM and remain relatively uniform through the Eocene with a slight oligotrophic dominance over the eutrophic assemblage. Percentages of radiolarians and planktonic and calcareous benthic foraminifers show bursts in abundance through the early Eocene. (For interpretation of the references to color in this figure legend, the reader is referred to the Web version of this article.)
Fig. 8. GR and sample-based TOC and HI measurements for Paleocene LW and MW sidewall core samples from the MC 84-1 King well (#34).
Fig. 9. (a) TOC histogram for Paleocene-Eocene Wilcox Gp samples from petroleum industry wells and scientific boreholes across the northern GoM. (b) Kerogen type for a subset of the samples in (a) determined by plot of S2 (hydrocarbon richness, mg HC/g rock) versus TOC. Wells are identified in Table 1 and Fig. 2.

+2

Productivity and organic carbon trends through the Wilcox Group in the deep Gulf of Mexico: Evidence for ventilation during the Paleocene-Eocene Thermal Maximum
  • Article
  • Full-text available

March 2022

·

190 Reads

·

7 Citations

Marine and Petroleum Geology

·

Marcie Purkey Phillips

·

·

[...]

·

Aaron Avery

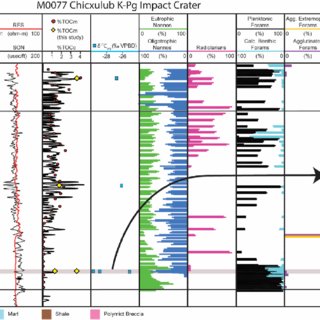
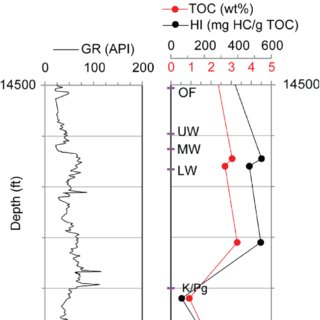
Deposition of the Paleocene-Eocene Wilcox Group (Gp) in the northern Gulf of Mexico (GoM) occurred during dramatic global climate and regional tectonic change. Key drivers impacting the GoM over this time were 1) significantly enhanced runoff and sediment supply from the developing Laramide hinterland, 2) intense global warming culminating in the Paleocene–Eocene Thermal Maximum (PETM) at ∼56 Ma, and 3) proposed Paleogene restriction of the GoM as Cuba docked with Yucatan-Bahamas-Florida. In this paper, we investigate biological and organic geochemical responses to these drivers across the PETM and identify spatial variations in productivity, oxygenation, and ultimately, ventilation. The PETM has been identified by calcareous nannofossil marker taxa and/or excursion taxa from the genera Rhomboaster and Discoaster that exclusively existed during the event. A calcareous nannofossil transition from cool eutrophic to warm oligotrophic assemblages occurs across the PETM broadly over the GoM suggesting that surface water nutrient supply decreased due to slowing circulation or increased sequestration of nutrients along the margins. Associated radiolarian bursts indicate additional factors, such as eustacy and runoff, may have modulated nutrient supply. Benthic habitats were impacted as agglutinated foraminifera, which were dominant in the Paleocene, disappeared at the PETM over submarine fan environments while calcareous benthic forams remained largely absent until the late Eocene. Deoxygenation may have contributed to benthic ecosystem decline as marine kerogen enrichment is noted broadly in the middle Wilcox and PETM. Total organic carbon is generally <3% except in more isolated marginal settings suggesting that deep-basin dysoxia co-existed with a variably enhanced oxygen minimum. We suggest these biotic and organic geochemical responses reflect connection to the Global Ocean during the PETM, with ventilation reduced but not eliminated by increases in salinity stratification due to runoff and reductions in deeper water entry into the GoM at gateways.

Download
Share

Citations (1)


... Recent major improvements in age control in the greater Gulf of Mexico Basin have come with the use of planktic foraminifers and calcareous nannofossils (Olson et al. 2015;Cunningham et al. 2022;Pessagno et al. 2023). These fossils are less sensitive to substrate conditions, have temporally short ranges in many cases and more global distributions. ...

Reference:

The End of the Cretaceous: Depositional paleogeographic reconstruction of the Gulf of Mexico and adjacent areas just prior to the Chicxulub impact
Productivity and organic carbon trends through the Wilcox Group in the deep Gulf of Mexico: Evidence for ventilation during the Paleocene-Eocene Thermal Maximum

Marine and Petroleum Geology